[1] "The answer is: 2"Introduction to CSS 211
Goals of the lecture
- Introductions
- What is CSS?
- What is this course for?
- Logistics
Who am I?
- Assistant Teaching Professor, Cognitive Science.
- Research interests: large language models (LLMs), language comprehension, Theory of Mind.
What is CSS?
In a nutshell, Computational Social Science focuses on computational approaches to social science.
At UCSD, Social Sciences encompasses many disciplines:
- Economics.
- Political Science.
- Cognitive Science.
- Sociology.
What are computational methods for?
Another way of asking this is: how do computational methods help us learn what we want to know?
- Many research questions benefit from large-scale quantitative analysis.
- Measuring trends over time.
- Comparing effects of policy interventions.
- Modeling the relationships between variables.
- Computational methods help us do this efficiently and reliably.
What is this course for?
The goal of this course is to introduce students to foundational concepts and methods in statistical modeling. We will emphasize both hands-on application and conceptual understanding.
Key concepts include:
- Data wrangling, summarization, and visualization.
- Modeling data and designing analyses.
- Interrogating the assumptions of an analysis or dataset.
Hands-on work will be done using the R programming language.
Learning outcomes
My goal is that by the end of this course, students will be able to:
- Define and explain key concepts in statistical inference and regression analysis.
- Identify appropriate visualizations and statistical methods for different kinds of research questions and datasets.
- Implement data wrangling, visualization, and analysis workflows in R.
- Interpret and evaluate results (visualizations, fit models, etc.) in the context of a research question.
- Design and implement a complete statistical analysis project from research question to interpretation.
Why R?
R is a programming language used to perform statistical analysis, wrangle data, make data visualizaitons, and more.
R is certainly not the only way to analyze data, but it’s a useful tool in your toolbox for a couple reasons.
- R has excellent packages (
lme4) for running analyses with mixed effects models. - R has the
tidyverse, a collection of packages for writing really clean code to wrangle, summarize, and visualize data.
- The
tidyverseincludesggplot, one of the best plotting packages I’ve ever used.
- R is integrated with platforms like RStudio, which enable creation of sharable code, websites, and slides (like these).
R: basics
R can be used to perform simple arithmetic calculations:
It can also be used to calculate summary statistics, like a mean or standard deviation (std).
R: simple histogram
R can also be used to visualize data.

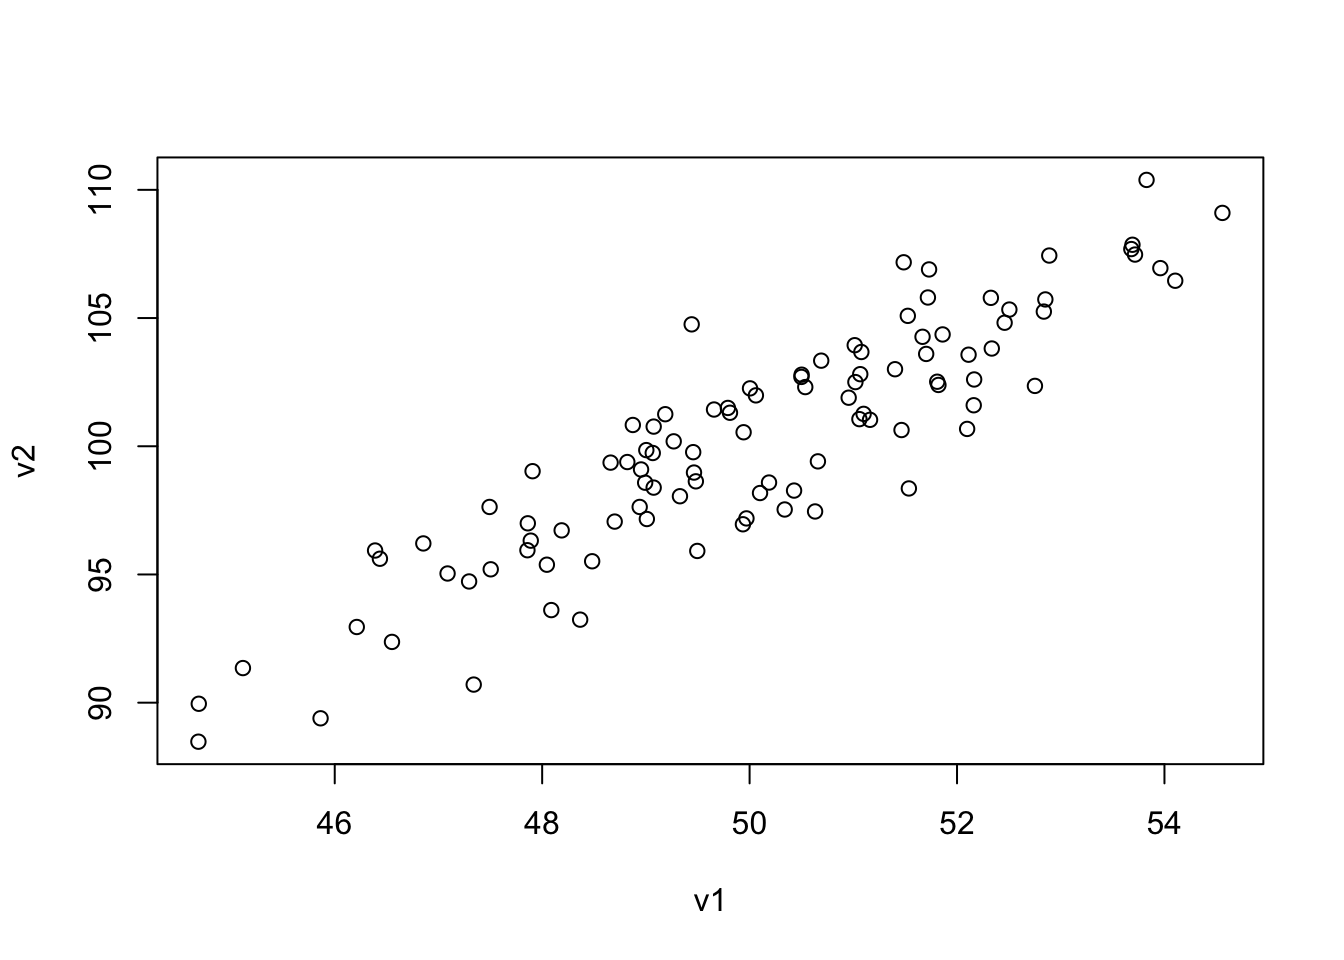
R: simple scatterplot
Scatterplots can be used to visualize relationships between data.
R: simple scatterplot
Scatterplots can be used to visualize relationships between data.
Logistics and course structure
Designing this course required some forethought. CSS is a broad discipline: what methods and content are useful for everyone?
My approach:
Course content and assessments should reflect underlying learning outcomes.
- Define and explain key concepts in statistical inference and regression analysis.
- Identify appropriate visualizations and statistical methods for different kinds of research questions and datasets.
- Implement data wrangling, visualization, and analysis workflows in R.
- Interpret and evaluate results (visualizations, fit models, etc.) in the context of a research question.
- Design and implement a complete statistical analysis project from research question to interpretation.
Assessment strategy
| Assessment | Percentage | Learning Outcome |
|---|---|---|
| Labs | 20% | Implementation, interpretation, evaluation |
| Concept quizzes | 20% | Defining, explaining |
| Midterm | 25% | Defining, interpreting, evaluating |
| Final project | 35% | Designing, identifying, implementing, evaluating |
Course policies
- Attendance: Recommended, not required.
- Dropped quiz: Your lowest quiz will be dropped from your grade.
- Late assignments: Generally not accepted except in cases of emergencies.
- If you have a midterm scheduling conflict, let me know as soon as possible so we can try to accommodate it.
- Getting help: Office hours from the teaching team generally preferred to email.
Note on AI usage
My research focuses on large language models (LLMs), which have seen incredible progress in recent years. I probably don’t need to tell you how powerful ChatGPT can be!
A few points need to be made here:
- Tools like ChatGPT will likely keep getting better, and we shouldn’t ignore that.
- Doing CSS “in the wild” may sometimes benefit from using ChatGPT!
- Separately, CSS “in the wild” is not done in an insolated test-taking environment.
- It’s also still important (I think) to learn the fundamentals .
- I can use ChatGPT more effectively when I know what I want to do.
- Thus, our assessments combine:
- Take-home work (more “ecologically valid”).
- Work requiring “endogenous” problem-solving (in-person midterm).
Final project
The final project will be done independently, and will involve replicating from start to finish a published analysis in the CSS domain of your choice.
- You have a lot of freedom here, but I recommend:
- Thinking about this early on. Happy to point people to useful resources!
- Choosing something that’s challenging (but also doable!).
- Extensions to existing work (e.g., new analyses) will be encouraged.
- Your deliverables will be:
- A final report (turned in via Canvas).
- A final presentation (delivered week 10).
Tooling, prerequisites, and tech setup
This course will involve quite a bit of programming in R.
- Week 1 will cover tooling. You’ll need R installed and RStudio.
- No explicit prerequisites, though some programming background (like CSS bootcamp!) will be helpful.
Topics and schedule
Topics will be roughly as follows:
- Week 1: Introduction to R and the RStudio environment.
- (Plus some philophy of science.)
- Weeks 2-3: Data wrangling and visualization.
- Weeks 4-5: Deep dive into linear regression.
- Weeks 6-8: Advanced statistical techniques.
- Weeks 9-10: Best practices, final project work and presentations.